
- Gold price is back under the $2,000 level, as sellers flex their muscles early Monday.
- US Dollar cheers a cautious mood, geopolitical risks, despite sluggish US Treasury bond yields.
- Gold price looks south, as the daily RSI flipped bearish after Friday’s breakdown.
Gold price is testing a 10-day low of $1,995 set on Friday, seemingly vulnerable early Monday, as the Big Central Banks week kicks off. The United States Dollar (USD) is clinging to its recovery gains amid a cautious market environment and steady US Treasury bond yields.
Gold price looks to US inflation data after Nonfarm Payrolls beat
Investors trade with caution at the start of the week that comprises key event risks for Gold price, including the US Consumer Price Index (CPI) inflation data and the Federal Reserve (Fed) interest rate decision and the updated projections. The upcoming US events are critical to the market’s repricing of the Fed’s interest rate expectations next year, especially after Friday’s upbeat US Nonfarm Payrolls data helped dial back Fed rate cut expectations for March.
The latest US labor market report showed that the economy added 199K jobs in November, as against a 150K increase in October and above expectations of +180K. The Unemployment Rate in the United States unexpectedly dropped to 3.7%, compared with a 3.9% print. The data portrayed the continued tightness in the country’s labor market, slashing March Fed rate cut bets to about 43% from 60% seen pre-data release.
This helped the US Treasury bond yields and the US Dollar extend their recovery momentum, accentuating the corrective downside in Gold price. Gold price fell to over one-week lows below $2,000, although managed to recapture the latter into the weekly close.
Moving back to the price action so far this Monday, Gold sellers are benefiting from the underlying US Dollar strength, as risk sentiment remains tepid due to renewed worries about China’s deflation and the ongoing geopolitical tensions between the US and Yemeni Houthis. The Iran-backed Houthi rebels in Yemen threatened to disrupt shipping in the Red Sea. On Friday, the French Navy’s multi-mission frigate, Languedoc, downed two Houthi drones in the Red Sea off the coast of Yemen. Meanwhile, Rockets were fired on Friday at the US embassy in Baghdad.
The potential horizontal escalation of the Israel-Hamas conflict in Gaza to the sea lanes off the Gulf of Aden is keeping investors on the edge. Meanwhile, China’s CPI fell the fastest in three years in November while factory-gate deflation deepened, suggesting rising deflationary pressures and dwindling economic recovery.
Risk trends, Fed expectations and the US Dollar dynamics will continue dominating the Gold price amid a quiet US economic docket on Monday.
Gold price technical analysis: Daily chart
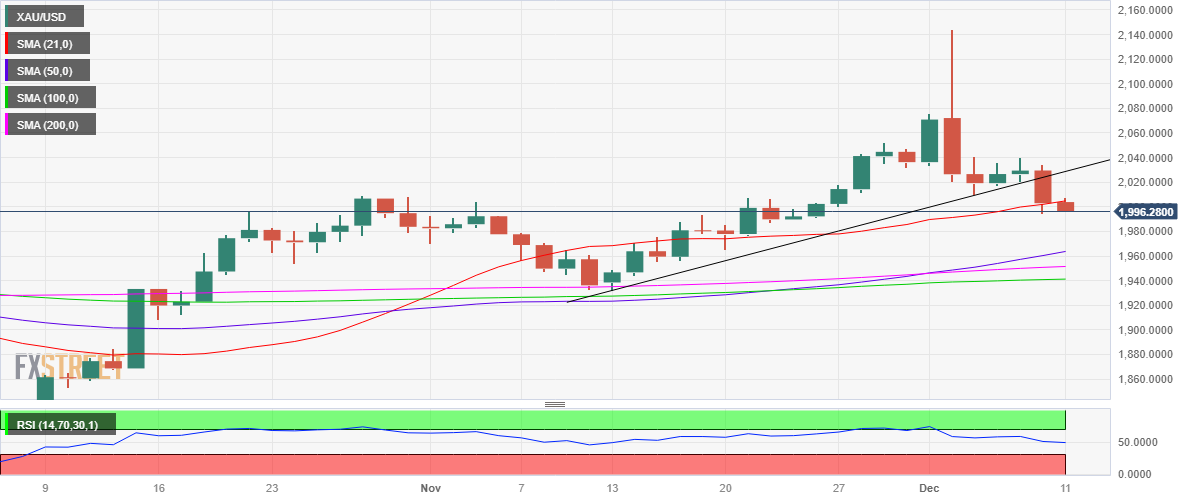
As observed on the daily chart, the tide has turned in favor of sellers after Gold price settled Friday below the rising trendline support at $2,024 and portrayed a breakdown.
The 14-day Relative Strength Index (RSI) indicator also drifted into the bearish zone, below the 50 level, pointing to more Gold price weakness ahead.
The immediate support is seen at Friday’s low of $1995, below which a sharp drop toward the $1,965 area cannot be ruled out. That price zone is the confluence of the November 20 low and the upward-pointing 50-day Simple Moving Average (SMA).
Before reaching the 50-day SMA cap, Gold sellers need to crack the static support at $1,980.
Meanwhile, Gold buyers would need acceptance above the 21-day SMA at $2,005 on a daily candlestick closing basis to initial a brief recovery toward the $2,040 supply zone.
The November 27 high of $2,018 could challenge bearish commitments beforehand.
 previous

