
- AUD/USD dropped to weekly lows near 0.6650.
- US CPI weighed on Fed’s interest rate cut bets.
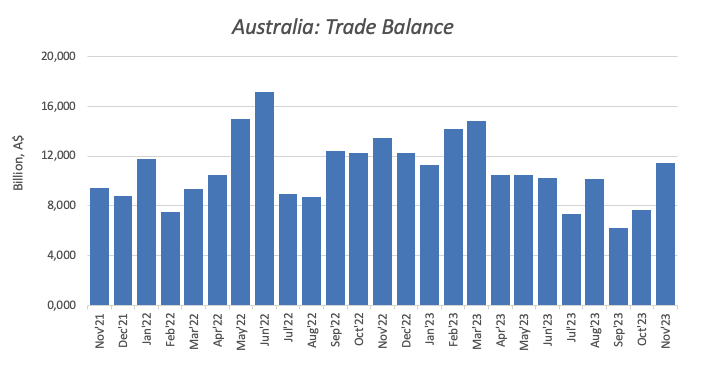
- Australian trade surplus surprised to the upside in November.
AUSD/USD rapidly faded Wednesday’s advance and refocused on the downside, briefly reaching fresh weekly lows in the 0.6650/45 band on Thursday.
The CPI-driven bounce in the greenback put the risk-associated universe under further pressure and forced the Aussie dollar to give away the earlier uptick to the 0.6720 zone, recorded in the wake of firmer-than-expected trade balance results in the domestic economy.
On the latter, the trade surplus in Australia widened to A$11.437B in November (from A$7.660B), with Exports up 1.7% vs. the previous month and Imports shrinking by 7.9% on a monthly basis.
Looking at the short-term picture, dynamics around the greenback are predicted to keep dictating the sentiment around the pair, with speculation of interest rate cuts by the Federal Reserve taking centre stage. The latest release of the US CPI, however, poured cold water over investors’ prospects of rate cuts as soon as March.
On the RBA side, recent inflation figures tracked by the RBA’s Monthly CPI Indicator suggest a pause by the central bank at its February gathering, despite the labour market remaining tight and with a scarce probability of much more cooling in the upcoming months, all leaving the RBA as one of the last central banks to (potentially) trim rates this year.
To the prospects of the central bank, investors should add the developments in the Chinese economy as another key driver for the price action of the Aussie dollar, as the post-pandemic rebound in that economy still remains elusive.
Looking at Friday’s calendar in Oz, the housing sector will be at the centre of the debate with the publication of Home Loans and Investment Lending for Homes, both gauges for the month of November.
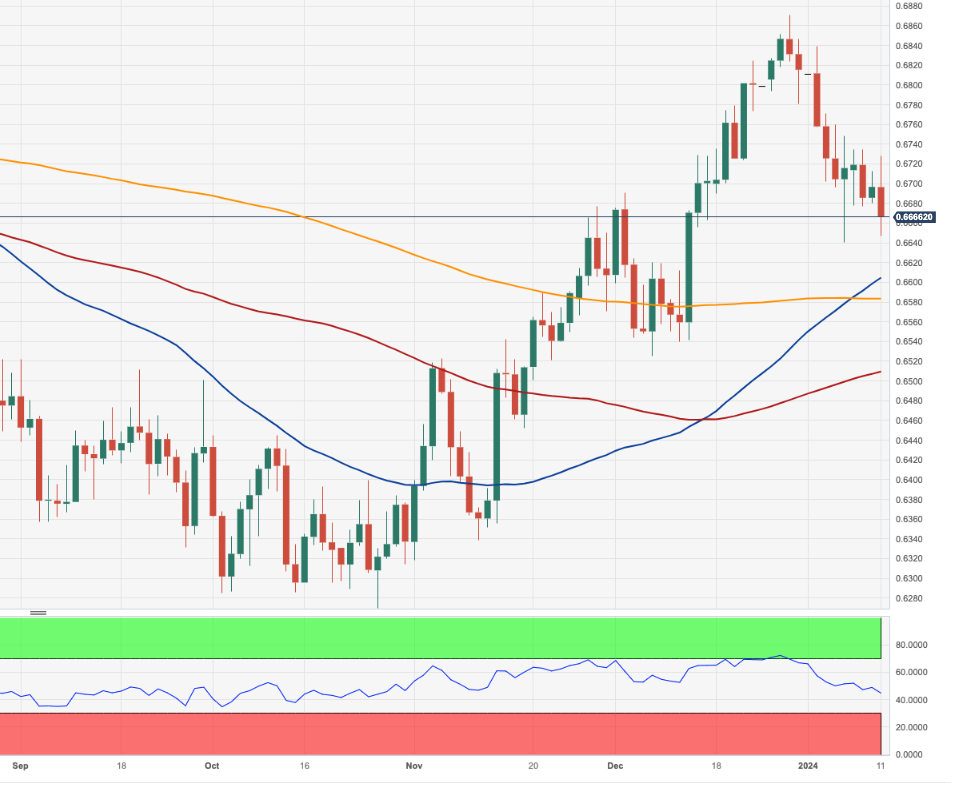
AUD/USD short-term technical outlook
The continuation of selling pressure might push the AUD/USD to the 2024 low of 0.6640 (January 5) before hitting the 200-day SMA at 0.6581. The December 2023 low of 0.6525 comes next seconded by the transitory 100-day SMA of 0.6504. If bulls regain the upper hand, the focus will transfer to the December 2023 peak of 0.6871 (December 28), which will appear before the July 2023 high of 0.6894 (July 14) and the June top of 0.6899 (June 16). If the pair breaks out of this range, the psychological level of 0.7000 will be the next to be monitored.
Still on the daily chart, a golden cross has emerged after the 55-day SMA crossed above the 200-day SMA in recent sessions, which could be indicative that a short-term rebound could be shaping up.
According to the 4-hour chart, the significant conflict zone is about 0.6650. If this zone is breached, there are no noticeable disagreement levels until 0.6525 and 0.6452. Furthermore, the MACD stays in the negative zone, indicating the persistence of a bearish bias, while the bounce of the RSI to the vicinity of 40 allows for some very near term rebound. The bullish trend, on the other hand, may encounter first resistance at the 55-SMA at 0.6736, which is seen as the last line of defense before the last high at 0.6870.
View Live Chart for the AUD/USD
 previous

