
- Gold price attracts some buyers for the second straight day, though lacks follow-through.
- Sliding US bond yields, along with geopolitical tensions, lend some support to the metal.
- The USD stands tall near the monthly peak and caps any further gains for the XAU/USD.
- Traders also seem reluctant and prefer to wait for the release of the US PCE Price Index.
Gold price (XAU/USD) edges higher for the second successive day on Friday, albeit lacks follow-through as traders opt to wait for the release of the US Personal Consumption Expenditures (PCE) Price Index before placing fresh directional bets. The Federal Reserve’s (Fed) preferred inflation gauge, or the Core PCE Index, which excludes more volatile food and energy costs, is seen easing from the 3.2% YoY rate to 3% in December and pointing to further progress on the disinflationary process. That said, robust US economic growth might complicate the path forward for monetary policy as cutting interest rates too quickly or too aggressively might pose a significant risk of reigniting inflation. In contrast, sticky inflation might give the Fed more headroom to keep rates higher for longer, suggesting that the path of least resistance for the non-yielding yellow metal is to the downside.
Heading into the key data risk, the US Dollar (USD) retains its bullish bias near the highest level since December 13 and acts as a headwind for the Gold price. The US Bureau of Economic Analysis (BEA) published the first estimate of the US Gross Domestic Product (GDP) on Thursday, which showed that the world’s largest economy expanded at an annualized rate of 3.3% in the fourth quarter. This marks a deceleration from the 4.9% growth recorded in the third quarter, though was well above the market expectations for a reading of 2% and raised hopes for a soft landing. Moreover, bets that the Fed might still cut interest rates in March lead to a further decline in the US Treasury bond yields. This, along with concerns that the Israeli-Hamas war could trigger a broader conflict in the Middle East, might continue to lend some support to the safe-haven precious metal.
The aforementioned mixed fundamental backdrop warrants some caution before positioning for any firm near-term trajectory as the focus remains glued to the highly-anticipated FOMC monetary policy meeting on January 30-31. Nevertheless, the Gold price seems poised to end in the red for the second straight week, also marking the third week of losses in the previous four, amid the uncertainty over the timing of when the Fed will start cutting interest rates.
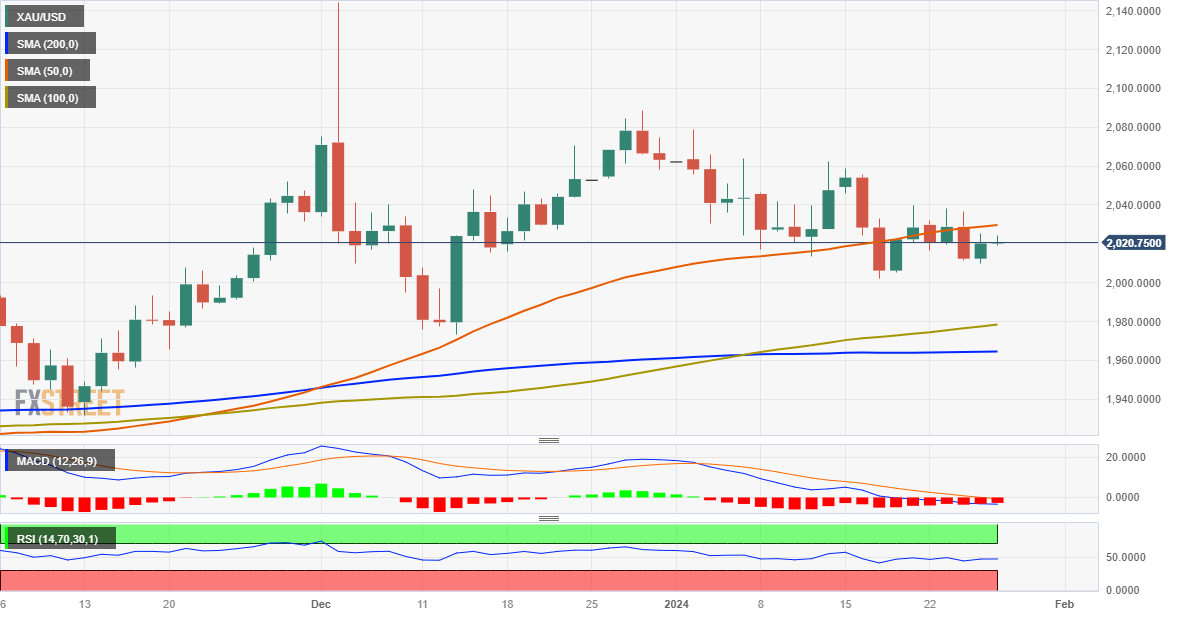
Technical Outlook
From a technical perspective, any subsequent move up beyond the 50-day Simple Moving Average (SMA), currently near the $2,026-$2,027 area, might continue to confront stiff resistance near the $2,040-2,042 supply zone. Some follow-through buying, however, might trigger a short-covering rally and lift the Gold price further to the $2,077 intermediate hurdle en route to the $2,100 round-figure mark.
On the flip side, the weekly low, around the $2,010-$2,009 area touched the previous day, could act as immediate support ahead of the $2,000 psychological mark. A convincing break below the latter will be seen as a fresh trigger for bearish traders and pave the way for a slide to the 100-day SMA, currently around the $1,975-1,976 area, before the Gold price eventually drops to the 200-day SMA, near the $1,964-1,963 region.
 previous

