
- AUD/USD partially reversed the recent steep pullback.
- The RBA left its OCR unchanged, as expected.
- The RBA’s Bullock sounded somewhat hawkish at her press conference.
Finally, some respite for the Aussie dollar came in the wake of the RBA’s widely anticipated decision to keep its Official Cash Rate (OCR) unchanged on Tuesday.
Indeed, the Reserve Bank of Australia maintained a hawkish stance by keeping interest rates unchanged at 4.35%, in line with expectations. However, it left the possibility open for a potential interest rate hike in the future. The Statement on Monetary Policy (SoMP) showed the RBA slightly lowered its inflation projections and anticipates both indicators to remain below 3% by Q4 2025. Additionally, the RBA reduced its GDP growth forecasts across the forecast period, largely due to a dimmer short-term outlook for consumer spending and housing investments.
At her press conference, Governor Bullock diverged from the anticipated shift towards a dovish stance and emphasized that addressing inflation remains incomplete, highlighting that the current inflation rate is deemed excessively high. Bullock underscored a neutral stance by stating, “We are neither committing to nor dismissing any course of action.”
Despite her assertive stance, market participants persist in pricing in a 50 bps reduction in interest rates for this year, with the initial cut fully anticipated by the August meeting.
Additionally, price action around the pair followed another positive session of the greenback, albeit this time advancing marginally, while the inconclusive price action in copper prices and the intense corrective retracement in iron ore seem to have limited the upside potential of AUD on Tuesday.
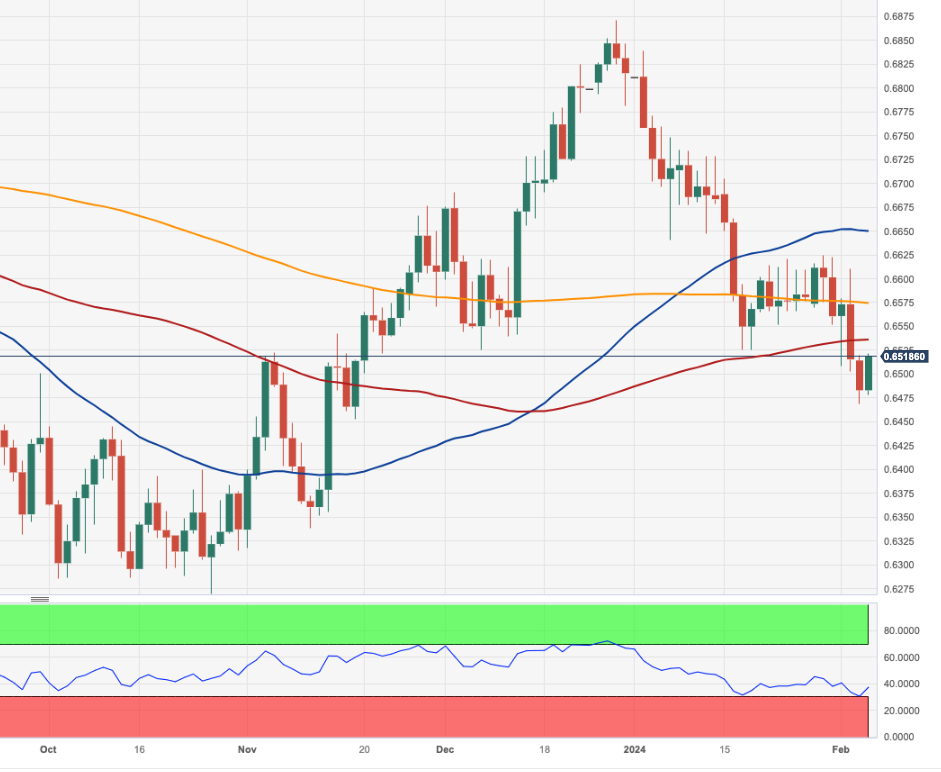
In spite of the daily recovery, AUD/USD keeps navigating its sixth consecutive week in negative territory, shedding around four cents since December 2023 peaks around 0.6870.
AUD/USD daily chart
AUD/USD short-term technical outlook
Further losses may drive the AUD/USD to revisit its 2024 level of 0.6468 (February 5), ahead of the 2023 low of 0.6270 (October 26). The breach of the latter might cause a test of the round level of 0.6200 to appear on the horizon prior to the 2022 low of 0.6169 (October 13). On the plus side, there is immediate barrier at the key 200-day SMA at 0.6572 ahead of the temporary 55-day SMA of 0.6643. The breakout of this zone may inspire the pair to go for the December 2023 high of 0.6871 (December 28), followed by the July 2023 top of 0.6894 (July 14) and the June 2023 peak of 0.6899 (June 16), all just ahead of the critical 0.7000 milestone.
The 4-hour chart indicates some consolidation in the immediate term, paving the way for a dip to 0.6452 once 0.6468 is cleared. On the bullish side, 0.6610 is an immediate hurdle ahead of the 200-SMA at 0.6664. The surpassing of this zone indicates a possible progress to 0.6728. The MACD retreats deeper into the negative zone, and the RSI approaches the 40 zone.
View Live Chart for the AUD/USD
 previous

