
- Gold failed to make a decisive move in either direction.
- $2,020 aligns as first near-term technical support for XAU/USD.
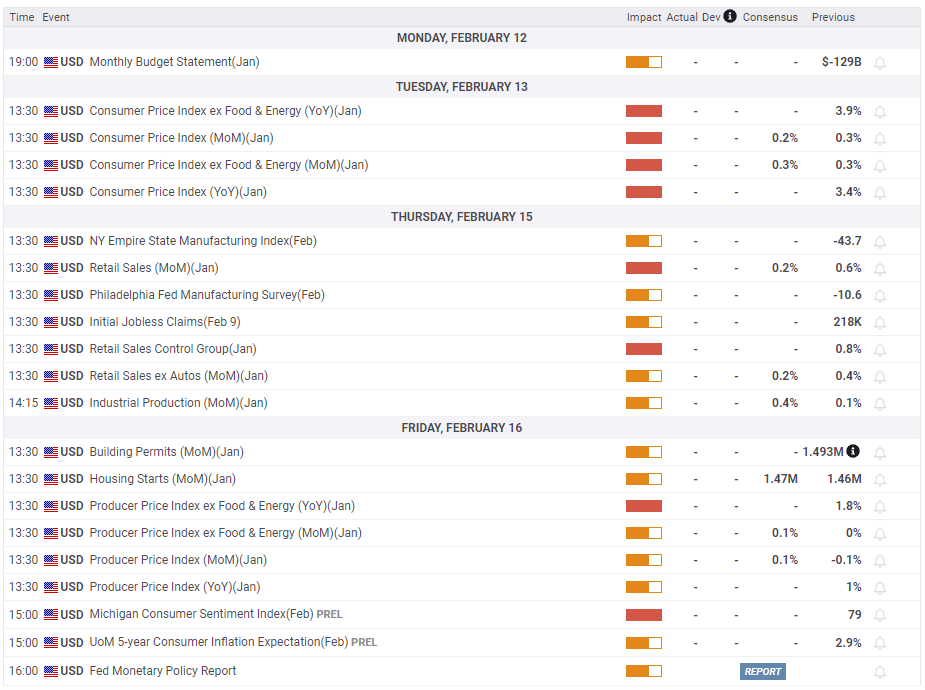
- January inflation data will be featured in the US economic docket next week.
Gold struggled to gather directional momentum and closed the week with marginal losses. Investors will scrutinize the January inflation data from the US next week and pay close attention to technical developments for a directional clue.
Gold price fluctuated in a relatively narrow channel this week
In a televised interview with CBS News’s 60 Minutes on Sunday, Federal Reserve (Fed) Chairman Powell repeated that the March policy meeting was likely too soon to have the confidence to start cutting rates. He also reiterated that they could move sooner if they saw labor market weakness or inflation coming down persuasively. The benchmark 10-year US Treasury Note yield extended the rally that was fuelled by the impressive jobs report and rose more than 3% on Monday, causing Gold to end the day in negative territory near $2,020.
In the absence of high-tier macroeconomic data releases and fundamental drivers, the US Dollar Index corrected lower alongside the US yields, allowing XAU/USD to stage a modest rebound.
Meanwhile, Qatar, acting as a mediator, said that Hamas had given a “generally positive” response to a proposed truce deal with Israel late Tuesday. This headline, however, failed to ease concerns over a deepening crisis in the Middle East, as an Israeli official told Israel’s Channel 13 that some of the demands made by Hamas in the counterproposal were entirely unacceptable.
On Wednesday, risk flows started to dominate the action in financial markets as the S&P 500 Index hit a new record high after the opening bell. Although the improving risk mood made it difficult for the USD to find demand, XAU/USD failed to gather bullish momentum. Later in the American session, the 10-year US T-bond yield climbed above 4.1% after the high-yield at the latest 10-year Treasury Note auction came in at 4.09%, forcing Gold to erase earlier gains.
The US Department of Labor reported on Thursday that there were 218,000 Initial Jobless Claims in the week ending February 3, down from the previous week’s revised 227,000. The USD held resilient against its rivals and Gold struggled to regain its traction. In the meantime, Richmond Fed President Thomas Barkin told Bloomberg that they have time to be patient on rate changes and said that he needs to see good inflation numbers being sustained and broadening.
On Friday, the US Bureau of Labor Statistics (BLS) announced that it revised the monthly Consumer Price Index (CPI) increase for December lower to 0.2% from 0.3%. The Core CPI was unrevised at 0.3% for the same period. Gold edged slightly lower in the American session as the 10-year US yield continued to stretch higher ahead of the weekend.
Gold price could react to US inflation data, technical developments
The BLS will release January inflation data on Tuesday. On a monthly basis, the CPI and the core CPI, which excludes volatile food and energy prices, are forecast to rise 0.2% and 0.3%, respectively. It will take a significant downward surprise in monthly CPI readings, at or below 0%, for market participants to reconsider the probability of a Fed rate cut in March. In this scenario, the 10-year US T-bond yield could retreat below 4% and help XAU/USD gather bullish momentum.
According to the CME FedWatch Tool, the odds of the US central bank maintaining the policy rate unchanged at the next policy meeting is 82.5%. The market positioning suggests that the USD doesn’t have a lot of room left on the upside in case CPI prints come in above market forecasts. Nevertheless, a hot inflation report could support US yields and make it difficult for Gold to gain traction.
On Thursday, the Retail Sales report for January will be featured in the US economic docket. This data is not adjusted for price changes and it’s unlikely to trigger a significant market reaction.
Ahead of the weekend, the Producer Price Index (PPI) data for January and the University of Michigan’s preliminary Consumer Sentiment Index data for February will be watched by market participants.
In summary, unless the US inflation report meaningfully alters the market pricing of the Fed rate outlook, investors are unlikely to take large positions based on next week’s data releases. Instead, they might keep a close eye on technical developments for near-term trading opportunities.
Gold technical outlook
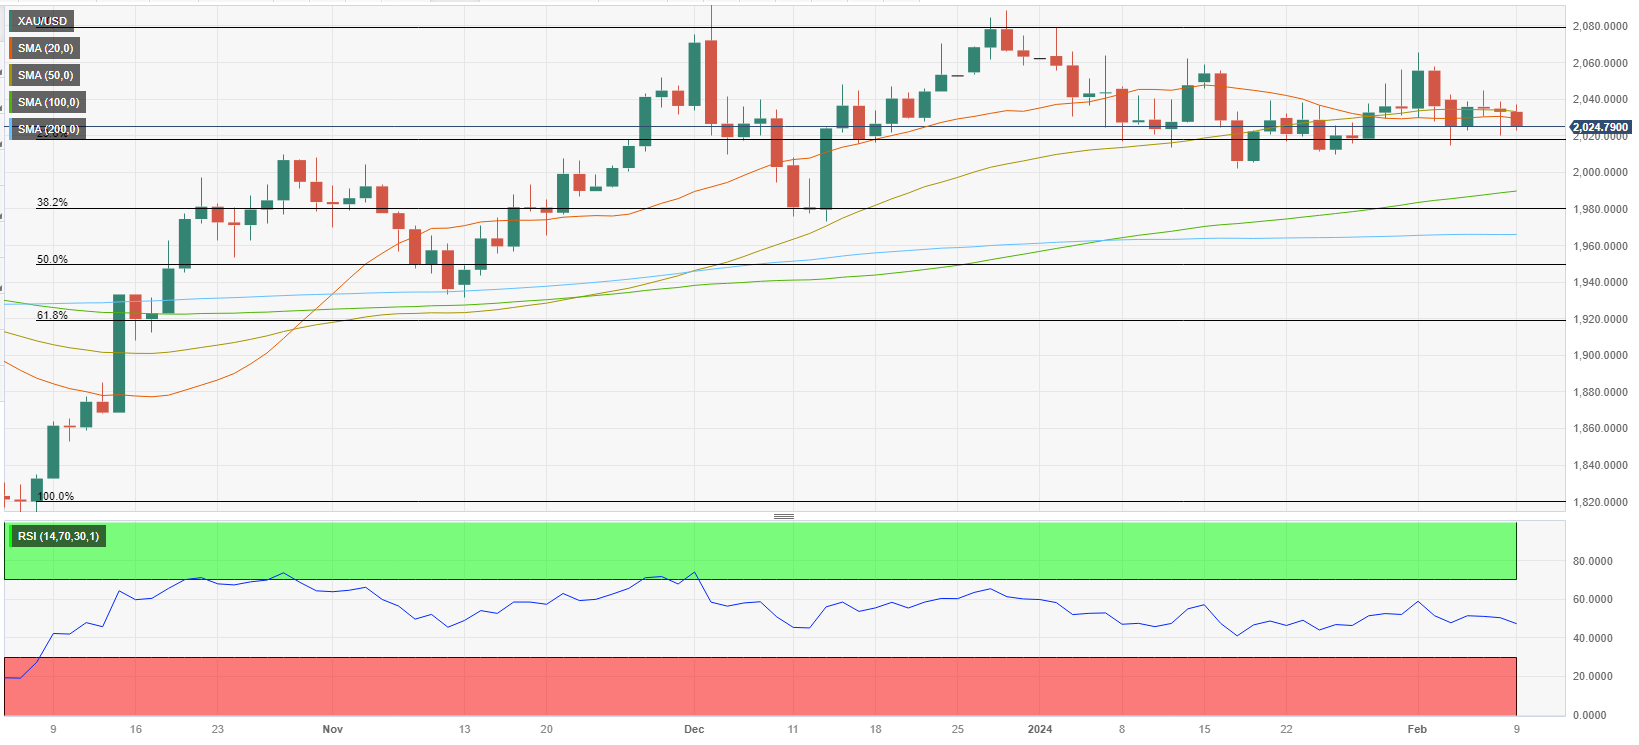
The Relative Strength Index (RSI) indicator on the daily chart moves sideways near 50 and XAU/USD struggles to pull away from the 20-day Simple Moving Average (SMA), reflecting the lack of directional momentum.
On the downside, $2,020 (Fibonacci 23.6% retracement of the latest uptrend) aligns as first support before $2,000 (psychological level, static level) and $1,990 (100-day SMA). On the other hand, interim resistance is located at $2,045 (static level) ahead of $2,060 (static level) aligns as first resistance before $2,080 (end-point of the uptrend).
 previous

