
- AUD/USD drops to new yearly lows near 0.6450.
- The US CPI-led bounce in the greenback weighed on spot.
- Consumer Confidence in Australia improved in February.
The Australian dollar encountered renewed selling pressure amidst the sudden and strong rebound in the US Dollar (USD), which was particularly exacerbated after US inflation figures rose more than expected in January.
On the latter, the intense buying pressure lifted the USD Index (DXY) to fresh tops near the 105.00 barrier for the first time since mid-November, along with an equally robust bounce in US yields, all in response to investors’ repricing of a potential rate cut by the Federal Reserve (Fed) later than anticipated (maybe June?).
Back to the domestic front, Tuesday’s strong retracement now leaves the door open to extra weakness in the Aussie dollar, which appears so far underpinned by USD dynamics, the yearly downtrend in prices of copper and iron ore, and the omnipresent uncertainty surrounding the Chinese economy.
On the positive side, the latest hawkish hold by the RBA in combination with the tight labour market and solid fundamentals should somehow maintain the downside pressure in the Australian currency.
Regarding the Reserve Bank of Australia (RBA), market participants continued to evaluate the recent interest rate decision after the central bank matched consensus and kept rates at 4.35% while suggesting a potential future rate hike.
In its Statement on Monetary Policy (SoMP), the RBA slightly revised downward its inflation forecasts, projecting both indicators to stay below 3% by the fourth quarter of 2025. Additionally, the RBA lowered its GDP growth projections, reflecting a less optimistic outlook for short-term consumer spending and housing investments.
AUD/USD daily chart
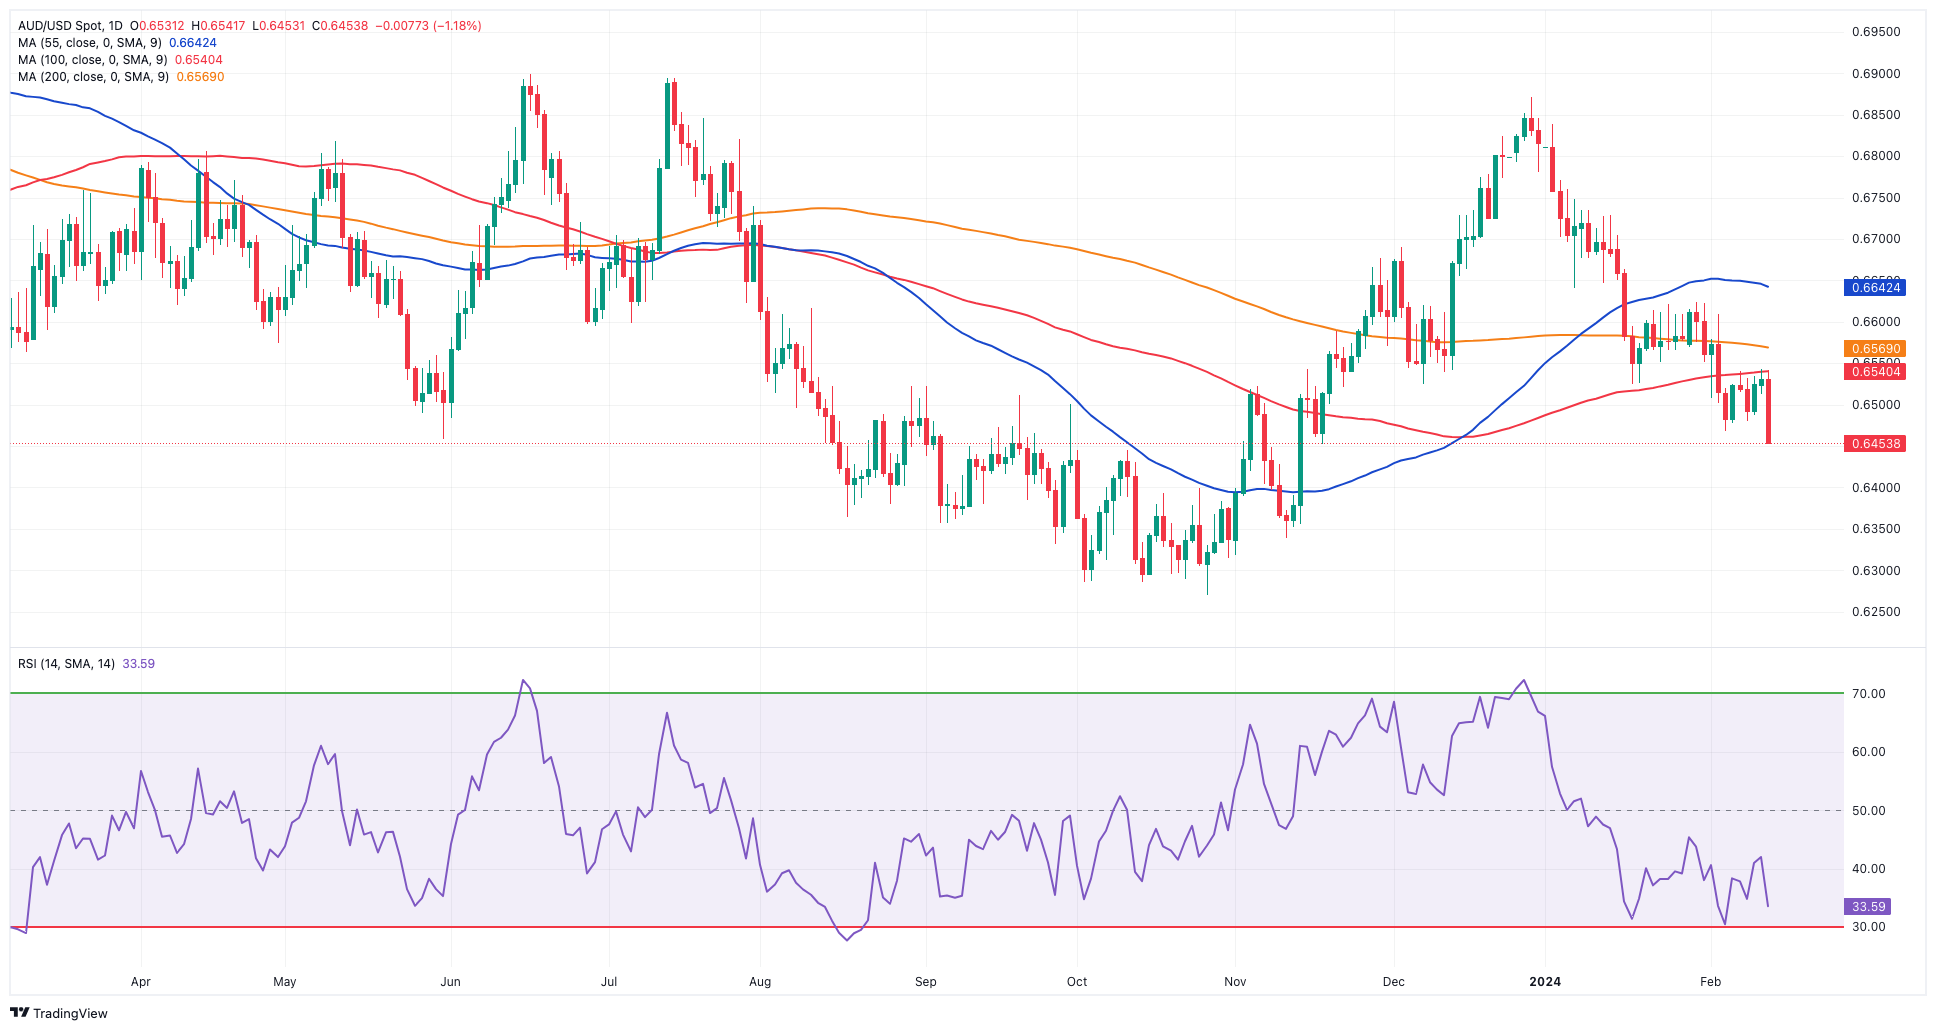
AUD/USD short-term technical outlook
The revival of the selling tendency may cause AUD/USD to initially challenge its 2024 bottom of 0.6452. (February 13). The loss of the latter might bring a probable test of the 2023 bottom of 0.6270 (October 26) back on the radar, ahead of the round level of 0.6200 and the 2022 low of 0.6169 (October 13).
On the upswing, the key 200-day SMA at 0.6567 looms as the next objective to watch before the intermediate 55-day SMA at 0.6638. The breakout of this zone may lead the pair to attempt the December 2023 top of 0.6871 (December 28), seconded by the July 2023 peak of 0.6894 (July 14) and the June 2023 high of 0.6899 (June 16), all just before the key 0.7000 threshold.
It is worth reiterating that AUD/USD needs to clear the key 200-day SMA on quite a convincing fashion to allow for extra gain in the short-term horizon.
The 4-hour chart suggests extra retracements in the near term. Meanwhile, clearing 0.6452 will result in a dip to 0.6347 ahead of 0.6338. On the bullish side, 0.6610 is an immediate hurdle ahead of the 200-SMA at 0.6624. The surpass of this zone indicates a possible progress to 0.6728. The MACD is approaching the positive zone, while the RSI approached the 30 yardstick.
 previous

